If you supply into UK grocery multiples, you already know the routine. Monday morning: log into Tesco TRS, download EPOS. Switch to Sainsbury's. Switch to Asda. Copy numbers into a master spreadsheet. Cross-reference against your ERP. Three hours gone before you've done any actual analysis.
Every growing food and drink brand between £20m and £150m faces this same challenge. You're supplying three to six retailers, each with its own portal, its own data formats, its own refresh schedule, and its own quirks. The data is available, but getting it into a single view requires manual effort that scales with every new listing.
This guide is a practical reference for what each major UK grocery retailer portal actually provides, how to access it, and how to stop spending your week as a human ETL pipeline.
The Bottom Line - UK FMCG brands typically juggle 3-6 retailer portals with incompatible formats and refresh schedules - 36.3% of CPG manufacturers cite lack of contextualised operational data as their AI/automation blocker (Schneider Electric, 2026) - Tesco TRS offers the most granular self-service data; Morrisons the least - Consolidation options range from free (3-8 hrs/week manual) to £5,000/month fully automated - Getting retailer data into a single view is the prerequisite for AI-driven demand forecasting
Why does retailer portal data matter for UK FMCG brands?
Fragmented operational data is the single biggest blocker to AI and automation adoption in CPG. Schneider Electric (2026) found that 36.3% of CPG manufacturers cite lack of contextualised operational data as the primary barrier to AI deployment. For UK food and drink brands, retailer portal data is where most of that operational context lives.
Your EPOS sales, stock levels, availability scores, and promotional performance data sit inside retailer portals. Without consolidating it, you can't answer basic questions like "which SKU is underperforming across all channels?" without opening four browser tabs and doing mental arithmetic.
The pattern we see most often: brands have the data they need, scattered across portals they log into inconsistently. The problem isn't access. It's assembly. And assembly is what burns 3-8 hours per week for every NAM and supply chain coordinator we've spoken to.
BCG (June 2026) found that data foundations separate the 18% of CPG companies who successfully scale AI from the 75% stuck in perpetual pilots. Retailer portal consolidation is step one of that data foundation.
Citation capsule: Schneider Electric (2026) reports 36.3% of CPG manufacturers cite lack of contextualised operational data as the primary AI/automation blocker. For UK food and drink brands, retailer portals hold the majority of operational data needed for AI-driven forecasting, but fragmentation across 3-6 portals makes consolidation the essential first step.
What data does Tesco TRS provide?
Tesco Retail Suite is the most data-rich portal available to UK FMCG suppliers. It offers daily EPOS sales at store level, depot stock, availability metrics, promotional performance, and forecast versus actual data. For brands with significant Tesco volume, it's the most important portal to master.
Data available
- EPOS sales: Daily, at individual store level. You can see exactly how many units sold in any given store on any given day.
- Stock: Depot-level stock holding, updated daily.
- Availability: On-shelf availability metrics by store and by SKU.
- Promotional performance: Uplift vs baseline, actual vs planned volume during promotions.
- Forecast vs actual: Tesco's forecast for your SKUs versus what actually shipped.
- Product data: Your product file, including any attribute flags.
Format and refresh
EPOS refreshes daily, usually available by mid-morning. Some reporting views aggregate weekly. Export format is CSV from the reporting module, with an online dashboard for quick views. The dashboard is functional but complex: training is required, and most brands only use 20-30% of its features.
Common frustrations
The interface requires training. New users find it overwhelming. Data exports have row limits, which means exporting a full year of store-level data for a large range requires multiple downloads. Column headers vary between report types, making automated ingestion harder than it should be.
Practical tip
Weekly scheduled downloads of your top 20 SKUs keep things manageable. Don't try to pull everything every time. Set up a core report for your key lines, run it weekly, and save ad-hoc deep dives for when you actually need them. We've seen NAMs waste hours downloading data they never look at.
Citation capsule: Tesco TRS provides daily EPOS sales at individual store level, depot stock, availability, and promotional performance data via CSV export. It offers the most granular self-service data of any UK grocery portal but has row limits on exports and a complex interface that requires dedicated training to use effectively.
What data does Sainsbury's NRM provide?
Sainsbury's has been consolidating its supplier-facing platforms. What was previously Supply4Sainsburys (S4S) has partially migrated into the Nectar Retail Media (NRM) ecosystem. For supply chain and commercial data, you're still dealing with the supplier portal functionality, but the branding and access points have shifted.
Data available
- Sales: Weekly, grouped by store cluster rather than individual store. Getting true store-level data is harder here than with Tesco.
- Availability: On-shelf availability metrics, typically at cluster level.
- Promotional uplift: Performance data for promoted lines, though depth of data depends on your account access tier.
- Supplier performance scorecard: This is the metric your buyer sees first. It covers delivery performance, availability contribution, and waste.
- Range data: Your listed range, any upcoming delistings, and range review information.
Format and refresh
Weekly refresh for most metrics. Online dashboards with export functionality. The interface is cleaner than Tesco's but less granular.
Common frustrations
Store-level data is harder to access than with Tesco. Some metrics require specific account access levels that not all brands have. The platform rebrand from S4S to NRM has caused confusion about where to find things. And if your buyer changes, access permissions sometimes need re-requesting.
Practical tip
The supplier performance scorecard is the first thing your buyer reviews before any conversation with you. Automate tracking it. Export it weekly, trend it in a spreadsheet, and flag any deterioration before your buyer does. Being proactive on scorecard dips shows operational maturity.
Citation capsule: Sainsbury's NRM (formerly S4S) provides weekly sales by store cluster, availability, promotional uplift, and a supplier performance scorecard visible to buyers. Store-level granularity is limited compared to Tesco TRS, and access tiers determine which metrics are available to each supplier.
How does Asda's supplier portal compare?
Asda's InfoBay provides daily EPOS data with a report builder interface for custom queries. It sits between Tesco (most data) and Morrisons (least self-service) in terms of what you can access independently.
Data available
- EPOS sales: Daily, with store-level granularity available through the report builder.
- Stock: Depot stock levels.
- Availability: On-shelf availability by store.
- Promotional effectiveness: Uplift data for promoted lines.
- Depot stock: Warehouse holding by product.
Format and refresh
Daily refresh for EPOS. The report builder generates CSV exports. You create custom reports by selecting dimensions and metrics, then export the result.
Common frustrations
The report builder interface is dated. Custom reports have size limits, so pulling broad datasets requires splitting into multiple runs. Some data views require specific permissions that aren't granted by default. And unlike Tesco's pre-built reports, you need to build most views yourself from scratch.
Practical tip
Set up saved reports for your core KPIs: weekly sales by top 20 SKUs, availability by depot, and promo uplift for live promotions. The initial setup takes an hour. After that, you're running the same saved query each week rather than rebuilding from scratch.
Citation capsule: Asda InfoBay provides daily EPOS sales with store-level granularity through a report builder interface, plus depot stock and availability data via CSV export. The interface is dated with size limits on custom reports, but saved report templates reduce ongoing effort once initial setup is complete.
What about Morrisons, Waitrose, and other retailers?
Morrisons uses IQNetworks (now part of the Blue Yonder ecosystem) for supplier-facing data. It's the least self-service of the big four.
Morrisons (IQNetworks / Blue Yonder)
- Data available: Sales, stock, availability, forecast accuracy.
- Format: Online dashboards with limited export options.
- Refresh: Varies by metric. Less consistent than Tesco or Asda.
- Frustrations: Platform changes have historically disrupted access. Less self-service than the other big four portals. Navigation is not intuitive.
- Tip: If you have a Morrisons-specific account manager, they can often pull reports you can't self-serve. Build that relationship.
Waitrose (Partner Portal)
Waitrose's supplier portal provides sales and availability data, but the depth is more limited than Tesco or Sainsbury's. Weekly data, dashboard-style interface. Export options exist but are basic.
Co-op
The Co-op supplier portal provides sales and availability data. The interface is functional but basic. Data is weekly. If Co-op is a smaller part of your mix, this is typically the last portal to integrate.
Aldi and Lidl
Minimal supplier-facing data portals. Both discounters provide limited self-service data access. Most performance information comes through your buyer directly, often via email or scheduled calls. Don't expect a data portal comparable to the big four.
M&S
M&S Product DNA handles technical product data. Commercial performance data typically comes through your buyer relationship rather than a self-service portal. The buyer interface differs from the technical supplier interface.
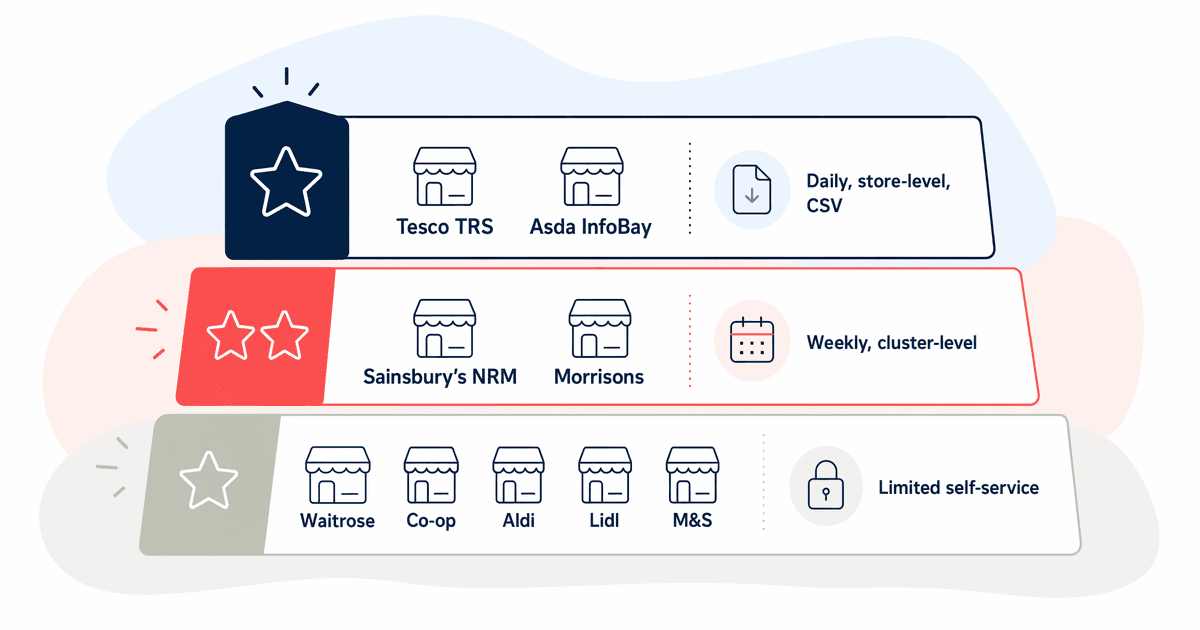
The gap between what the big four provide and what the secondary retailers offer is significant. If you're consolidating data, start with Tesco, Sainsbury's, and Asda. Morrisons adds complexity without proportionate data depth. The others can wait until your core three are flowing reliably.
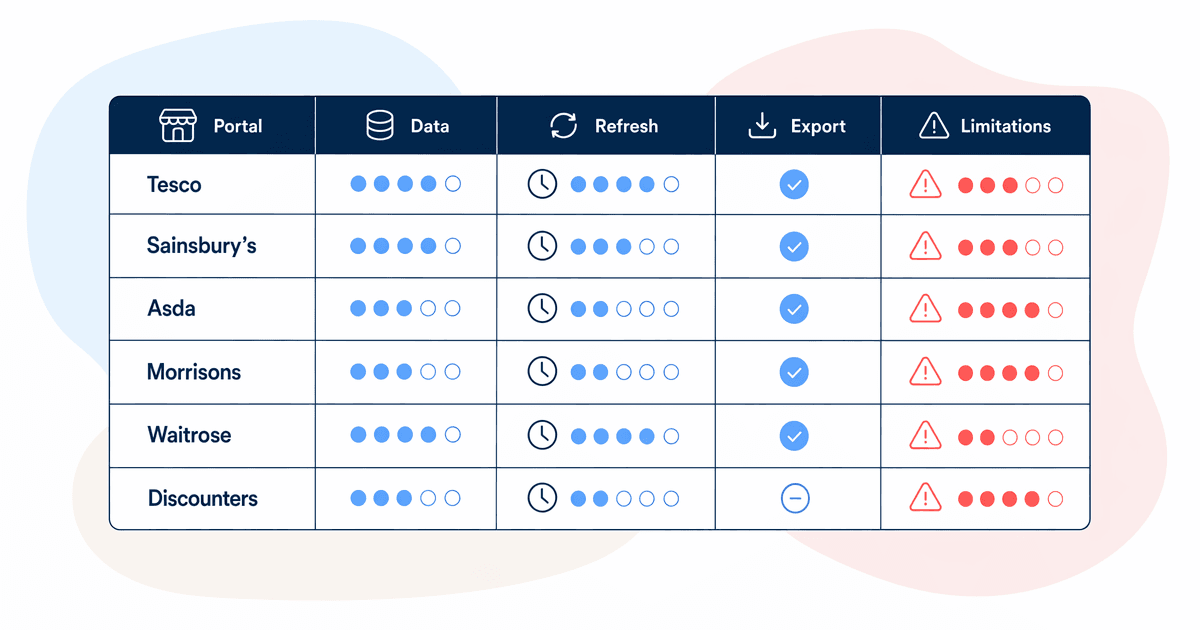
The comparison table
| Retailer | Portal Name | Data Types | Refresh | Export Format | Key Limitations |
| Tesco | TRS (Tesco Retail Suite) | EPOS (store-level), stock (depot), availability, promo performance, forecast vs actual | Daily (EPOS), weekly (some reports) | CSV, online dashboards | Row limits on exports, complex interface, training required |
| Sainsbury's | NRM / S4S | Sales (cluster-level), availability, promo uplift, supplier scorecard | Weekly | Dashboard with export | Store-level data limited, access tier dependent, platform rebrand confusion |
| Asda | InfoBay | EPOS (store-level), stock, availability, promo effectiveness, depot stock | Daily (EPOS) | Report builder CSV | Dated interface, size limits on custom reports, permissions gaps |
| Morrisons | IQNetworks / Blue Yonder | Sales, stock, availability, forecast accuracy | Varies | Dashboard, limited export | Platform instability, minimal self-service, inconsistent refresh |
| Waitrose | Partner Portal | Sales, availability | Weekly | Basic export | Limited depth, basic interface |
| Co-op | Supplier Portal | Sales, availability | Weekly | Basic export | Functional but basic, limited granularity |
| Aldi/Lidl | N/A | Minimal | Via buyer | N/A | No meaningful self-service portal |
| M&S | Product DNA (technical) | Technical product data; commercial via buyer | Varies | Limited | Commercial data not self-service |
How do you consolidate data from multiple retailer portals?
Getting data out of individual portals is one problem. Getting it into a single view is where most brands actually get stuck. Schneider Electric (2026) confirmed that 36.3% of CPG teams cite fragmented data as the primary blocker. Consolidation is the fix.
You have three approaches, and the right one depends on your team size, budget, and how many retailers you supply.
Approach 1: Manual (free, 3-8 hours/week)
Download from each portal weekly. Paste into a master spreadsheet. Standardise column headers manually. This is where every brand starts. It works until you're in four or more retailers, at which point the time cost and error rate make it unsustainable.
- Cost: Zero software cost, 3-8 hours/week staff time
- Pros: No setup, no dependencies, full control
- Cons: Error-prone, single point of failure, doesn't scale
Approach 2: Semi-automated (2-4 hours setup, saves 50-70% of time)
Use Power Query in Excel, Google Sheets imports, or basic scripting to pull and standardise downloaded files. You still do the downloads manually, but the consolidation step is automated. Column mapping happens once during setup rather than every week.
- Cost: 2-4 hours initial setup, under 1 hour/week ongoing
- Pros: Significant time saving, repeatable, reduces errors
- Cons: Still requires manual downloads, breaks when portal formats change
Approach 3: Fully automated (£500-£5,000/month)
Third-party aggregators like Atheon, Edge by Ascential, or Crisp handle the connection, download, and normalisation. They maintain the integrations so you don't have to. Custom-built integrations using browser automation or API connections are another option, though they require ongoing maintenance.
- Cost: £500-£5,000/month depending on retailer count and data volume
- Pros: Zero manual effort, consistent data model, scales easily
- Cons: Monthly cost, vendor dependency, onboarding takes 4-8 weeks
The pattern we see most often with brands in the £20-£50m range: they start manual, hit the pain point around their third or fourth retailer listing, move to semi-automated with Power Query, and eventually invest in a third-party tool once the commercial case is clear. Brands above £80m typically go straight to a third-party solution because the staff time cost already justifies it.
Citation capsule: UK FMCG brands consolidating retailer portal data face three options: manual assembly (free, 3-8 hrs/week), semi-automated with Power Query (saves 50-70% of time after 2-4 hours setup), or fully automated third-party tools from providers like Atheon or Edge by Ascential (£500-£5,000/month). Schneider Electric (2026) found 36.3% of CPG teams cite fragmented data as their primary automation blocker.
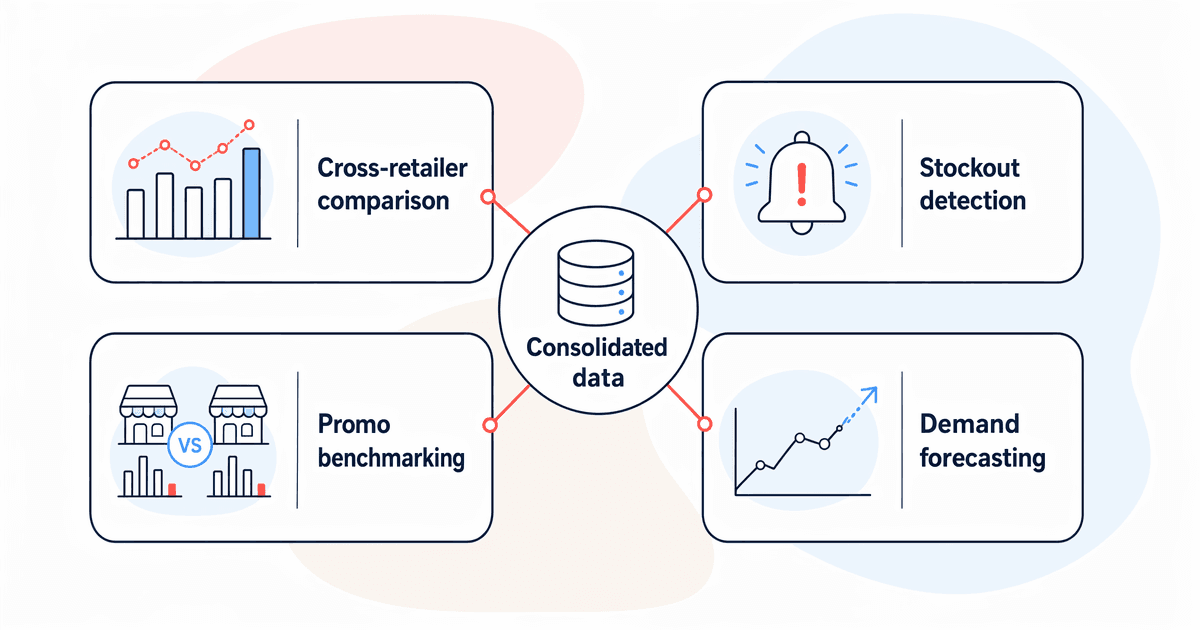
What can you actually do with consolidated retailer data?
Once retailer data lands in a single, consistent format, analysis that was previously impractical becomes straightforward. BCG (June 2026) found that data foundations separate the 18% of CPG companies who scale AI from the 75% stuck in pilots. Consolidated retailer data is that foundation.
Cross-retailer performance comparison
When your Tesco, Sainsbury's, and Asda data sits in one view, you can immediately spot which SKUs perform differently across channels. A line that's growing 15% in Tesco but declining 8% in Asda tells you something specific about ranging, pricing, or shelf position in one account.
Early stockout detection
Depot stock data from multiple retailers, viewed together, reveals patterns before they become out-of-stocks. If depot stock is declining across two retailers simultaneously, you've got a supply issue. If it's just one, you've got a demand or ordering issue at that specific retailer.
Promotional effectiveness benchmarking
Compare uplift percentages across retailers for the same or similar promotions. Did a BOGOF perform better in Tesco than Sainsbury's? Was it the mechanic, the timing, or the in-store execution? You can't answer these questions without cross-retailer data in one place.
Feeding demand forecasting
This is where retailer portal data becomes the input to something bigger. AI-driven demand forecasting needs historical sales, stock, and promotional data in a consistent format. Every week you delay consolidating this data is another week of training data your forecasting model doesn't have.
We've found that brands who consolidate retailer data first and then evaluate AI tools make significantly better purchasing decisions. They know what their data looks like, what's clean, what's messy, and what's missing. Brands who buy an AI forecasting tool first and then try to feed it retailer data typically discover data quality issues six weeks into a paid contract.
Citation capsule: BCG (June 2026) found that data foundations separate the 18% of CPG companies who scale AI from the 75% stuck in perpetual pilots. For UK FMCG brands, consolidated retailer portal data enables cross-retailer performance comparison, early stockout detection, promotional benchmarking, and AI-driven demand forecasting.
FAQ
How long does it take to set up automated retailer data feeds?
Semi-automated approaches using Power Query or Google Sheets take 2-4 hours of initial setup per retailer connection. Fully automated third-party tools like Atheon or Edge by Ascential typically require 4-8 weeks for onboarding, including data mapping and validation. The ongoing maintenance for semi-automated setups is minimal unless a portal changes its export format.
Do you need all retailers consolidated before AI forecasting works?
No. Start with your largest volume retailer. A forecasting model trained on clean, consistent data from one retailer outperforms one trained on patchy data from four. BCG (June 2026) emphasises that 18% who scale AI focus on data quality over data breadth. Add retailers incrementally once the first connection is stable.
Which third-party tools consolidate UK retailer portal data?
Atheon Analytics, Edge by Ascential (formerly Edge TPM), and Crisp are the most common in UK FMCG. Pricing ranges from £500/month for a single retailer connection to £5,000/month for multi-retailer, high-volume setups with advanced analytics. Each handles the portal integration and data normalisation so your team doesn't maintain scripts.
Is it worth automating if you only supply two retailers?
At two retailers, semi-automated consolidation using Power Query is usually sufficient. The time investment is 2-4 hours upfront and saves roughly 2 hours per week. Full automation makes commercial sense once you're in four or more retailers, or once your range exceeds 50 SKUs across multiple accounts.
What to do next
The retailers aren't going to standardise their portals. Waiting for APIs or unified platforms is not a strategy. The practical path forward: pick your highest-volume retailer, get that data flowing into a consistent format weekly, then add the next one.
If you're spending more than 3 hours per week on report assembly from retailer portals, you've already passed the threshold where semi-automation pays for itself. The tools exist. The question is whether you set them up this month or keep burning time for another quarter.
The brands who get this right build a data foundation that makes everything else easier: demand forecasting pilots that actually have training data, analytics dashboards that update themselves, and automated reporting that frees your team to do analysis instead of assembly.