
Nobody starts a business thinking "I can't wait to build a 47-tab workbook for promo reporting." Yet here we are. Spreadsheets creep into every operational workflow because they're familiar, flexible, and free — and the problem isn't that you started with them. It's that they don't scale, and the failure mode is silent enough that nobody raises it until real damage is done.
Your team doesn't notice the bottleneck forming. What they notice is working late on Wednesdays pulling numbers together, or the promo report always running a day behind, or the MD asking questions that nobody can answer without "pulling the data" from three different files and hoping the formulas haven't drifted.
The Bottom Line - Operations teams lose 22+ workdays per year per employee fixing spreadsheet errors (DOSS, 2026) - 94% of business spreadsheets contain errors, with cell error rates between 0.9% and 1.8% (Frontiers of Computer Science, 2024) - 69% of food and beverage brands still rely on spreadsheets and email for supply chain operations (TraceGains, 2025) - The cost compounds with growth — each new retailer, SKU, or channel adds manual reconciliation that never flattens out
How Much Time Are You Actually Losing to Manual Reporting?
Operations professionals spend an average of 3.6 hours per week fixing spreadsheet mistakes — that's 22 full workdays per year, per employee (DOSS, 2026). For a three-person commercial team at a growing FMCG brand, that adds up to 66 days of annual capacity burned on rework rather than ranging decisions, promotional planning, or margin analysis.
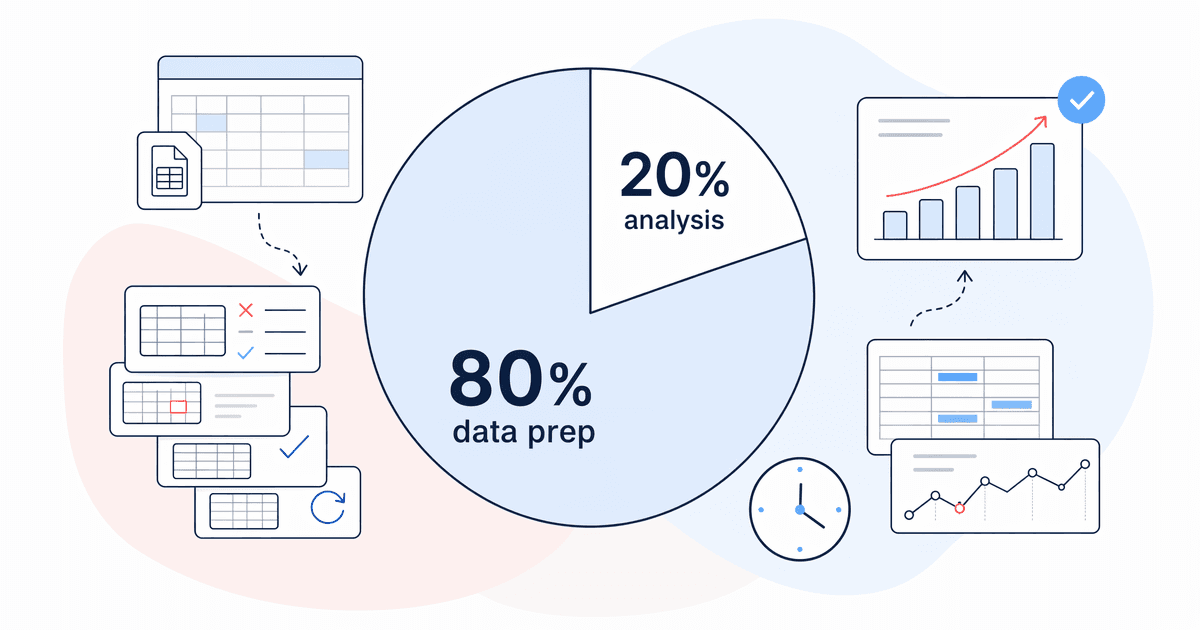
And that's just the error correction. The preparation work is significantly worse. Gartner's research found that 80% of reporting and analytics effort goes into preparing and reconciling data rather than analysing it or acting on the results. A separate insightsoftware study of 500 finance professionals confirmed that 75% of finance teams dedicate at least five to six hours each week to recreating reports — up to 300 hours per year spent rebuilding the same outputs (insightsoftware, 2024).
<!-- [ORIGINAL DATA] -->
Our observation: Across FMCG brands we've worked with, the reporting bottleneck typically surfaces between 15 and 25 SKUs per retailer. Below that threshold, one person can hold the workbook together through sheer familiarity. Above it, the manual workload multiplies faster than headcount ever will.
Think about what that means in practice. Your Category Manager isn't doing category management — they're doing data entry with a fancier job title, spending most of their week assembling numbers rather than interpreting them. Is that really what you're paying £55k–£70k a year for?
Why Do 94% of Spreadsheets Contain Errors?
A 2024 meta-analysis spanning 35 years of research found that 94% of business spreadsheets contain errors (Poon et al., Frontiers of Computer Science, 2024). Field audits by Dartmouth's Tuck School of Business put the cell error rate at 0.9%–1.8% of all formula cells — which sounds small until you realise a typical promo reporting workbook might contain 2,000+ formulas, each one a potential point of failure.
At a 1% error rate, that's 20 wrong cells in a single workbook. Some will be trivial rounding differences. Others won't be — the Dartmouth research found the largest single error in their sample exceeded $100 million (Powell, Baker & Lawson, Tuck School of Business).
The DOSS 2026 survey broke down the most common error types across 1,003 operations professionals:
| Error Type | Frequency |
| Manual data entry mistakes | 59% |
| Formula errors | 46% |
| Copy-paste issues | 45% |
Here's what makes this particularly dangerous for growing brands: two in five workbook incidents get fixed without ever being reported to leadership (DOSS, 2026). Your MD is making decisions based on numbers that have already been quietly corrected by someone on the team — or worse, numbers that contain errors nobody has spotted yet.
According to the same research, a single significant Excel error costs organisations an average of $4,315. For 53% of teams, these errors happen weekly. That's not a rounding error on a P&L — it's a consistent margin leak that manifests as missed orders, expedited freight charges, or lost revenue during peak demand windows.
What Happens When You Add a New Retailer or Channel?
<!-- [PERSONAL EXPERIENCE] -->
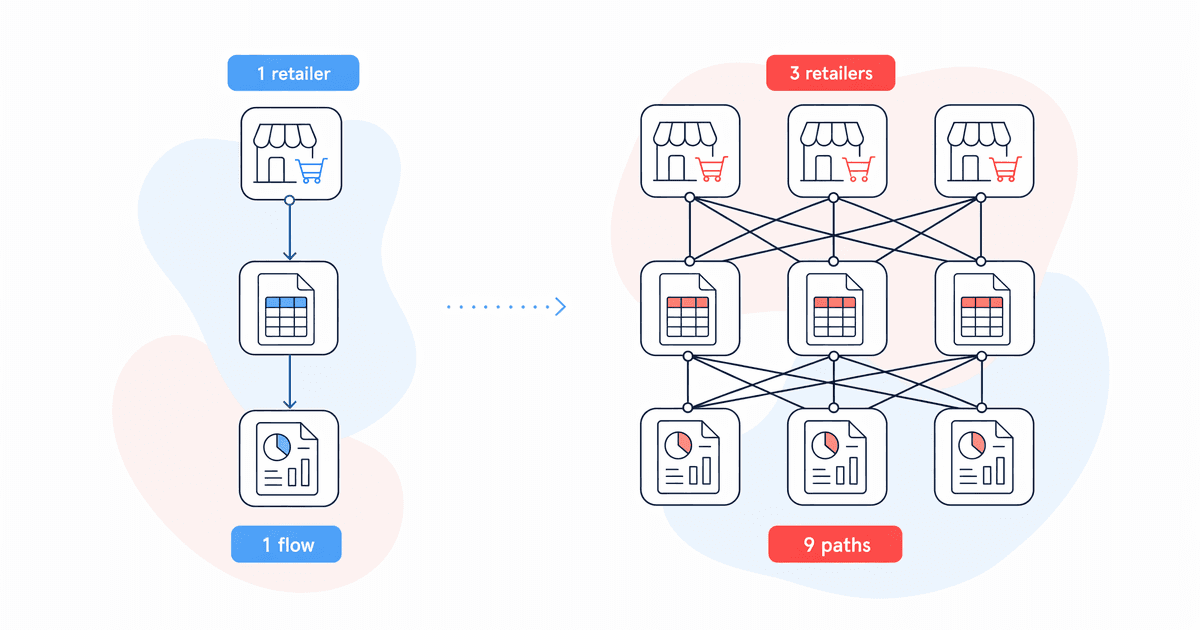
What we've seen: Every time a brand adds a new retail partner, the reporting workload doesn't grow linearly — it compounds. A new retailer means a new data format, a new reporting cadence, new promo mechanics to track, and another set of reconciliation steps bolted onto the existing workbook that's already straining under its own complexity.
This is the point where spreadsheet-based reporting shifts from "tolerable admin" to a structural constraint on the business. The workload scales with assortment complexity, promotional activity, and channel mix — and it never flattens out, because each new source creates reconciliation work against every existing source.
A 2025 TraceGains study of 165 food and beverage supply chain leaders found that 69% still rely on Excel files and email for day-to-day operations. Of those attempting to modernise, 60% are stuck in the implementation phase, with 40% blaming complexity and delays. Nearly a third (29%) admit their current methods are inefficient and have created internal bottlenecks (TraceGains, 2025).
The earlier 2024 TraceGains survey of 483 F&B suppliers put it more bluntly: 71% say outdated processes "sometimes or often" create day-to-day issues. The biggest pain points were time-consuming tasks (60%), data entry errors (39%), and miscommunication between teams (32%) (TraceGains, 2024).
This is the same class of problem that comes up when deciding whether to connect systems or keep adding spreadsheets. The answer depends on how many reconciliation paths you're managing — and whether anyone still trusts the output.
Why Does Nobody Trust the Numbers?
Here's a stat that should worry anyone running an FMCG business: 67% of organisations don't completely trust the data they use for decision-making (Precisely, 2024). Data quality was cited as the number one challenge impacting data integrity by 64% of respondents — up from 50% the previous year, which suggests the problem is getting worse even as awareness grows.
When your Commercial Director asks "how did the Tesco promo perform?" and the answer requires three people, two hours, and a caveat that "these numbers might be slightly off" — you don't have a reporting system. You have a confidence problem that ripples into every commercial decision downstream.
The 2024 FP&A Trends Survey found that only 35% of finance professionals' time goes on high-value tasks like generating insights and advising the business. The other 45% is consumed by non-value-adding activities — primarily data collection, validation, and reconciliation between systems that don't talk to each other.
This isn't just an efficiency issue. It's a decision-quality issue. If your promo report takes three days to compile, you're making next week's decisions based on last week's data — and in categories where availability windows are measured in hours, that delay has a direct cost in missed sales and wasted promotional spend.
Only 41% of organisations have a formal quality-control process for the workbooks used in high-stakes decisions, yet 60% admit they're too dependent on them (DOSS, 2026). That gap between dependency and governance is exactly where margin quietly disappears.
What Does This Actually Cost a Growing Brand?
Let's put real numbers on it. A Sontai analysis of FMCG reporting costs estimated that a single brand spends £28,000–£37,000 per year purely on assembling data and checking reports (Sontai, 2026). That figure covers only the compilation work — nobody in that cost line is actually analysing anything or making decisions based on what they've found.
For Indian FMCG distributors, SpireStock calculated that a mid-sized operation (300 retailers, 8 salesmen, 175 orders/day) loses Rs 24–38 lakh per year to Excel-related inefficiencies — a figure that covers data entry staff costs, error-related losses, untracked crate losses, delivery disputes, and management reconciliation time (SpireStock, 2025).
<!-- [UNIQUE INSIGHT] --> The pattern is consistent regardless of geography or brand size: the cost of manual data compilation scales non-linearly with operational complexity. Double your SKU count or add two retailers and the reporting workload doesn't double — it roughly triples, because every new data source creates cross-referencing requirements with every existing source in the chain.
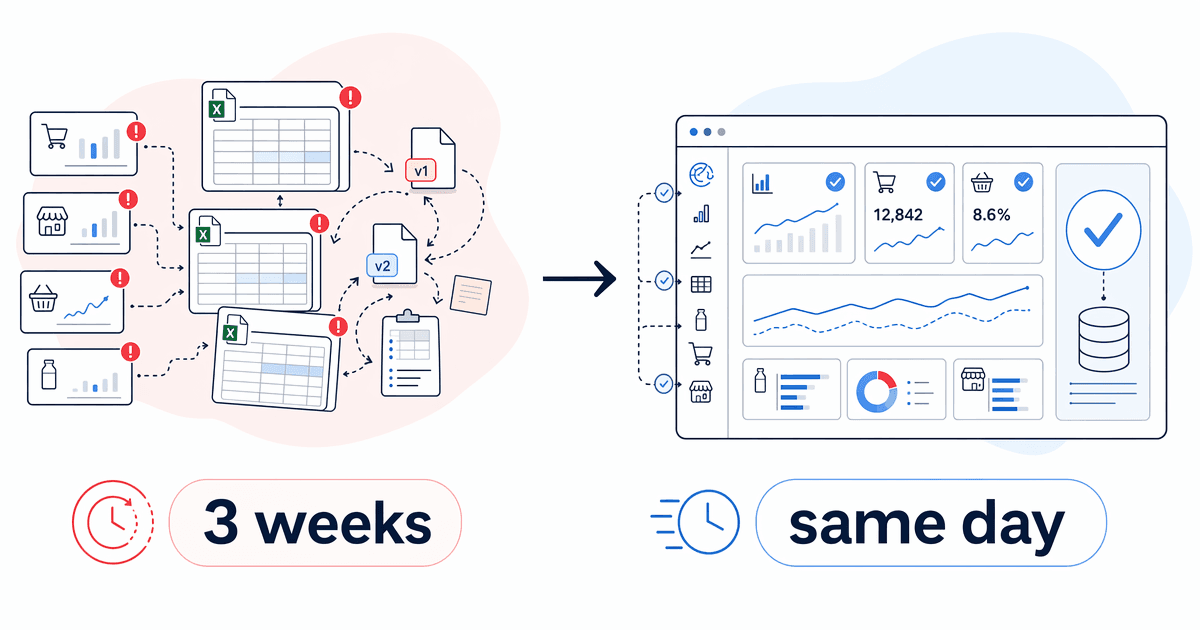
A DataPhi case study with an F&B producer in KSA demonstrated what happens when you break out of this pattern: 23% reduction in inventory wastage and a 3-week reduction in management reporting cycles after implementing centralised analytics (DataPhi, 2026).
Three weeks. That's how far behind the spreadsheet-dependent version of the same business was operating — making decisions on month-old data while competitors with connected systems acted on yesterday's numbers.
Why Can't You Just Hire More People?
This is the first instinct when reporting starts breaking. The promo report is late, so you hire a Commercial Analyst. The stock variance reports are unreliable, so you add a Supply Chain Coordinator. Each hire solves the immediate pressure, but none of them fix the underlying architecture that created the problem.
A Log-hub Supply Chain Network Design assessment found that only 30% of organisations have truly integrated standards across their entire company, while 20% have no real process at all. The vast majority still rely on "Excel, partial integration, or ad-hoc tools" (Log-hub / Supply & Demand Chain Executive, 2025).
Hiring into that environment means more people doing manual work on fragmented data — you haven't reduced the bottleneck, you've distributed it across more desks with more workbook versions to reconcile.
The AbcSupplyChain S&OP survey of 160+ professionals captured this well: 81% still use Excel or Google Sheets for sales and operations planning. But the real insight isn't that the tool is inadequate — it's that most companies haven't built a structured process underneath it (AbcSupplyChain, 2025).
"Even with SAP, we always end up back in Excel. It's the only thing that really works." — S&OP Lead, Pharmaceutical Sector (AbcSupplyChain survey respondent)
More people plus no process equals more file versions, more reconciliation steps, and more "which one is the right one?" conversations every Monday morning. That isn't scaling — it's multiplying the problem. The question usually isn't whether you need AI or automation to fix it; it's understanding which one actually solves the bottleneck you're facing.
When Does Reporting Stop Being Admin and Start Being a Growth Constraint?
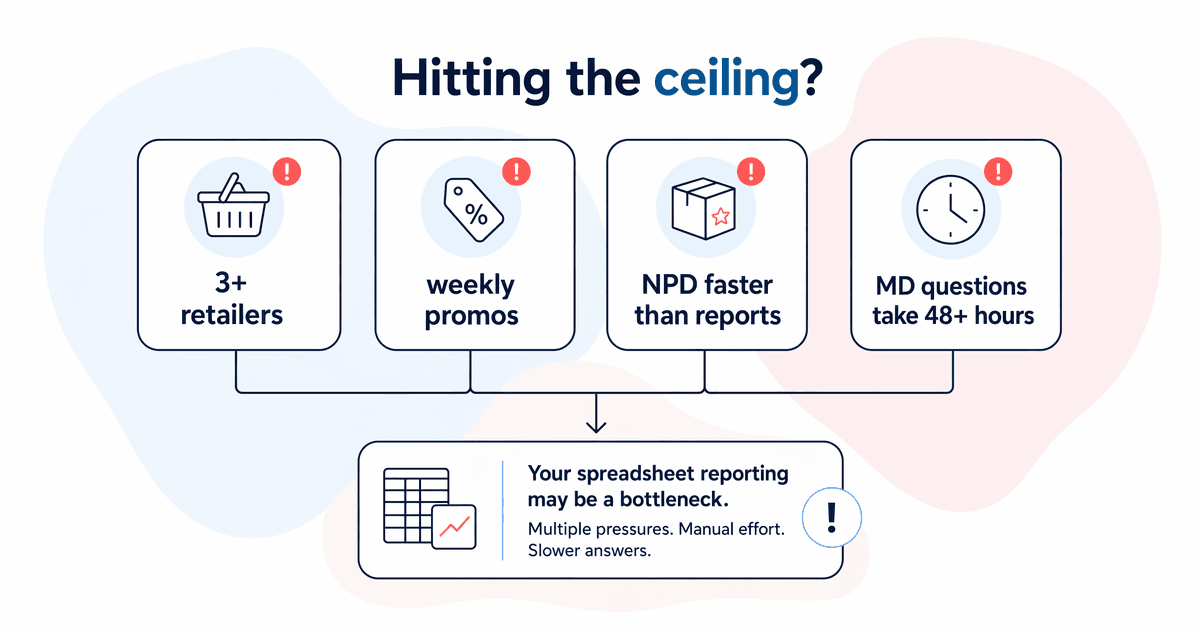
Manual reporting becomes a growth constraint at the exact point where your team's capacity to compile data limits how fast you can act on it. For most FMCG brands, that tipping point arrives when:
- You're selling into 3+ retailers with different data formats
- You're running weekly or fortnightly promotions that need performance tracking
- Your NPD pipeline requires ranging decisions faster than reports can be compiled
- The MD or board starts asking questions that take 48+ hours to answer
At that point, you're not paying for reporting — you're paying for the absence of insight. The opportunity cost is the ranging decision not made, the underperforming promo not pulled early, the supplier negotiation entered without accurate COGS data. None of these missed opportunities show up on any spreadsheet, which is precisely why they compound unchecked.
The Precisely 2024 survey found that 77% of organisations rate their data quality as "average at best" — an 11-percentage-point decline from the previous year. The number one factor preventing high-quality data? Inadequate tools for automating data quality processes, cited by 49% of respondents (Precisely, 2024).
The 2025 AutoRek payments survey reinforced this at scale: 90% of organisations still rely on spreadsheets for financial operations, and 64% are still processing data at a transaction level — introducing bottlenecks and delays that actively prevent them from scaling (AutoRek / PR Newswire, 2025).
What Does Moving Off Spreadsheets Actually Look Like?
Let's be clear about what this isn't. It isn't a six-month ERP implementation, and it isn't ripping out everything to start from scratch. For most FMCG brands in the £20m–£150m range, the path out of manual reporting is more targeted than that.
The DataPhi case study showed that connecting existing operational systems into a centralised data layer — without replacing them — delivered a 28% improvement in margin variance detection and reduced reporting cycles by three weeks (DataPhi, 2026).
The practical pattern we see working:
- Identify the report that hurts most — usually the weekly promo performance or stock availability report
- Map where the data actually lives — ERP, retailer portals, broker spreadsheets, internal logs
- Connect the sources into a single layer — not a new system, just a data pipeline that pulls and reconciles automatically
- Build the report once — then let it refresh without human intervention
- Redirect the freed-up time — toward analysis, action, and decisions that drive margin
If you're looking at that list thinking "step 2 sounds like process mapping" — you're right. The approach is the same one we cover in our guide on turning a manual process into an automated workflow. The difference is that reporting workflows tend to be the highest-frequency, lowest-exception processes in the business, which makes them the easiest to automate well and the fastest to show ROI.
This isn't about technology for its own sake. It's about breaking the dependency between "having data" and "having someone available to manually compile it into something usable."
Frequently Asked Questions
How much time do teams spend fixing spreadsheet errors?
Operations professionals spend an average of 3.6 hours per week fixing workbook mistakes, totalling more than 22 full workdays per year per employee (DOSS, 2026). That figure only covers error correction — data preparation and reconciliation between sources typically adds another 5–8 hours weekly on top.
What percentage of spreadsheets contain errors?
A 2024 meta-analysis published in Frontiers of Computer Science reviewed 35 years of research and found that 94% of business spreadsheets contain errors. Field audits at Dartmouth's Tuck School put cell error rates between 0.9% and 1.8% of all formula cells, with the largest single confirmed error exceeding $100 million.
Why do FMCG companies still use spreadsheets for reporting?
Familiarity, flexibility, and zero procurement friction. An AbcSupplyChain survey found 81% of S&OP professionals still use Excel or Sheets because it's what everyone already knows. The tool isn't the root cause — most companies haven't built process underneath it — but the flexibility that helps early on becomes a liability once complexity grows.
At what point does spreadsheet reporting break down?
Typically when a brand sells into 3+ retailers with different data formats, runs regular promotions requiring performance tracking, or expands channels. Each new data source creates cross-referencing requirements with every existing source, so the workload compounds non-linearly rather than growing in proportion to revenue.
How much does a single spreadsheet error cost?
A 2026 DOSS survey found the average cost is $4,315 per significant error, manifesting as missed orders, expedited freight, or lost peak-period revenue. For 53% of teams these errors occur weekly — suggesting an annualised error cost north of $224,000 for organisations where workbook-based reporting is the primary operating model.
The Reporting Problem Is a Growth Problem
Spreadsheet reporting isn't broken when you're doing £5m in revenue with two retail partners — it's perfectly adequate at that scale, and nobody should feel bad about using it. The problem is that it doesn't announce when it's breaking. You find out after the fact, once you've already lost time, margin, and decisions you didn't know you were missing.
The research is consistent across every study we reviewed: 94% error rates, 22 workdays lost per person per year, 80% of reporting effort spent on preparation rather than analysis. These aren't edge cases or findings from organisations with unusually bad practices — they're the norm for any business that hasn't moved past manual workbooks for operational reporting.
The question isn't whether spreadsheet reporting becomes a bottleneck. It's whether you recognise it before or after it's already constrained your next phase of growth.
If the numbers in this article look familiar, it might be worth a conversation about where your data and reporting setup actually stands — and what it would take to stop paying for report assembly and start paying for insight.
Sources for this article include peer-reviewed research (Poon et al. 2024, Powell et al. 2009), industry surveys with disclosed methodology (DOSS n=1,003; TraceGains n=483 and n=165; insightsoftware n=500; AutoRek n=500; AbcSupplyChain n=160+), and practitioner case studies. All statistics are cited inline with source, year, and link where available.