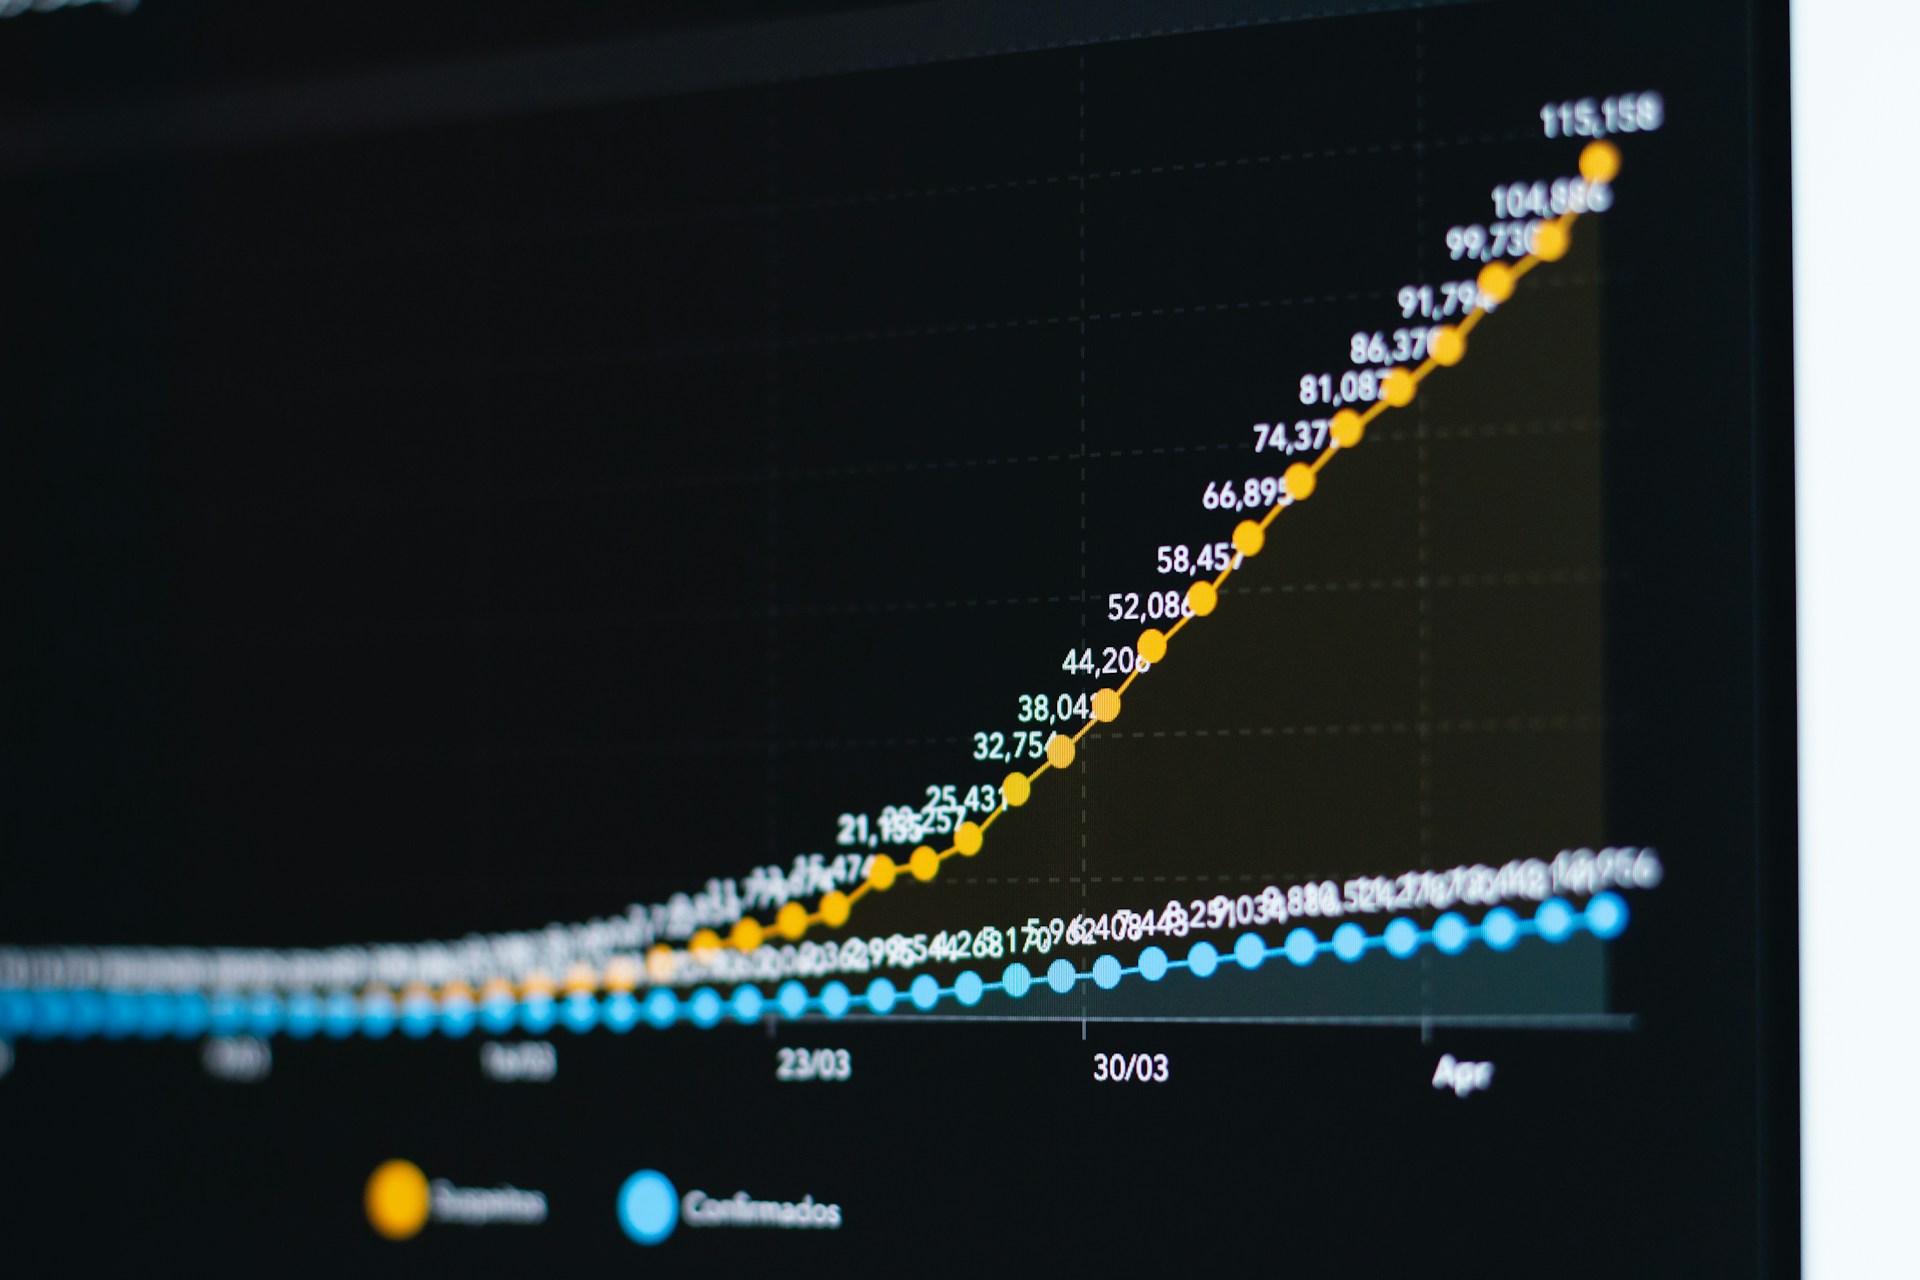
I don’t need to remind anyone that deals with data how frustrating it is stitching various data sources together at the end of each quarter. It takes up countless hours, may seem dysfunctional and is always looming round the corner. Yet carrying out this activity is crucial for assessing your company’s performance, ensuring you continue to improve.
Put simply, FMCG companies are awash with data; this is both a blessing and a curse. If handled correctly, however, one could stay ahead of competition, whilst simultaneously freeing up time to focus on, you guessed it, what matters. Now, you might have heard of Power BI. It’s become integral to many industries, being valued at £22 billion as of 2022, and projected to double in size by 2030. Other industries have already caught on, and now is time for forward-thinking FMCG companies to follow suit.
I believe this industry is primed for a rapid and comprehensive uptake. Whether it be live data on which product is selling fastest, how your net profit is tracking, or how much product has been manufactured so far that day, clever trickery has enabled this once pipedream to be realised, all the while being presented in the palm of your hand.
Legacy systems that manifest as data silos are the scourge of many FMCG companies. One source might be Excel, another an ERP software, maybe even an old manufacturing Data Historian! Taming this beast in the past would often involve overhauling data gathering and analysis itself, which eats up workers’ hours, incurs significant costs, or being shelved until someone brave enough came along. Well, fear not – you now might not need that enthusiastic employee, just Power BI.
With over out of the box 200 connectors (and the ability to build your own), all the above can be integrated into Power BI minus the migraines (perhaps a few headaches)! Think about it; once configured correctly, gone would be the days of piecing together disconnected data, trends, workflows and performance. My first experience of deploying this very type of system was in a financial advisory firm. Customer satisfaction data, email response rates and company performance metrics were visualised with terrific results. It made workloads reduce dramatically and perhaps most importantly enabled the director to identify weaknesses and their source, from once siloed data pools! This use case is small fry compared to the FMCG industry’s large number of data sources, which makes it all the more valuable.
Given that data workers waste 44% of their time on unsuccessful activities, predominantly in finding and preparing the data, it is no understatement to say it would be prudent to consider facilitating the Single Source of Truth model.
Forget speedometers and fuel gauges for a second; the word dashboard is increasingly being used to refer to a mosaic of analytics. Power BI and Tableau are the leading tools in generating these pages, each with their individual strengths that cater for the user’s requirements. Yet, it’s Microsoft’s far-reaching ecosystem that has led 97% of Fortune 500 companies to be actively using it.
The reasons for its ubiquity are clear: low maintenance, live data feed, ease of configuration and its range of analytical tools to name a few. Combined, sophisticated dashboards are made possible for business big and small. Now is the time for the FMCG industry to capitalise on these newfound analytical capabilities. Decision makers are able to access these dashboards on the go, or drill into the data at their desk, with surprising interactivity.
But why for FMCG in particular, you ask? Well, the sheer amount of data available in these businesses and necessity for quick decisions in a competitive landscape lends itself to live dashboards. To reiterate, once they are built, minimal maintenance is required, enabling those interested to quickly augment further insights into the page without increasing the workload of each month’s quarterly report.
Tech-focused industries have taken to Power BI like ducks to water, whilst others have lagged behind. A Forrester study across industries justifies the reason for their hasty uptake, with an average ROI of 366% over 3 years and payback in less than 6 months. It’s not a question of if FMCG businesses will adopt it, but when. I believe many larger companies will already have plans to bring Power BI into their business, with most solely relying on it in 5 years’ time.
Whether you are an active user of Power BI, or excited by its capabilities – we can assist you at BazBiff. Get in touch if you want to find out how I have helped other businesses to harness the potential of the data they are sitting on.